This small tip is on how to add a filter to a dashboard with the current month on top, so it is easier to navigate for users.
Not one which will drastically change your dashboard, but a ‘quality of life’ usability tip.
Improving the Usability of Dropdowns
This tip is about an annoyance not many people complain about, but as a developer you want to make the life of a user as easy as possible.
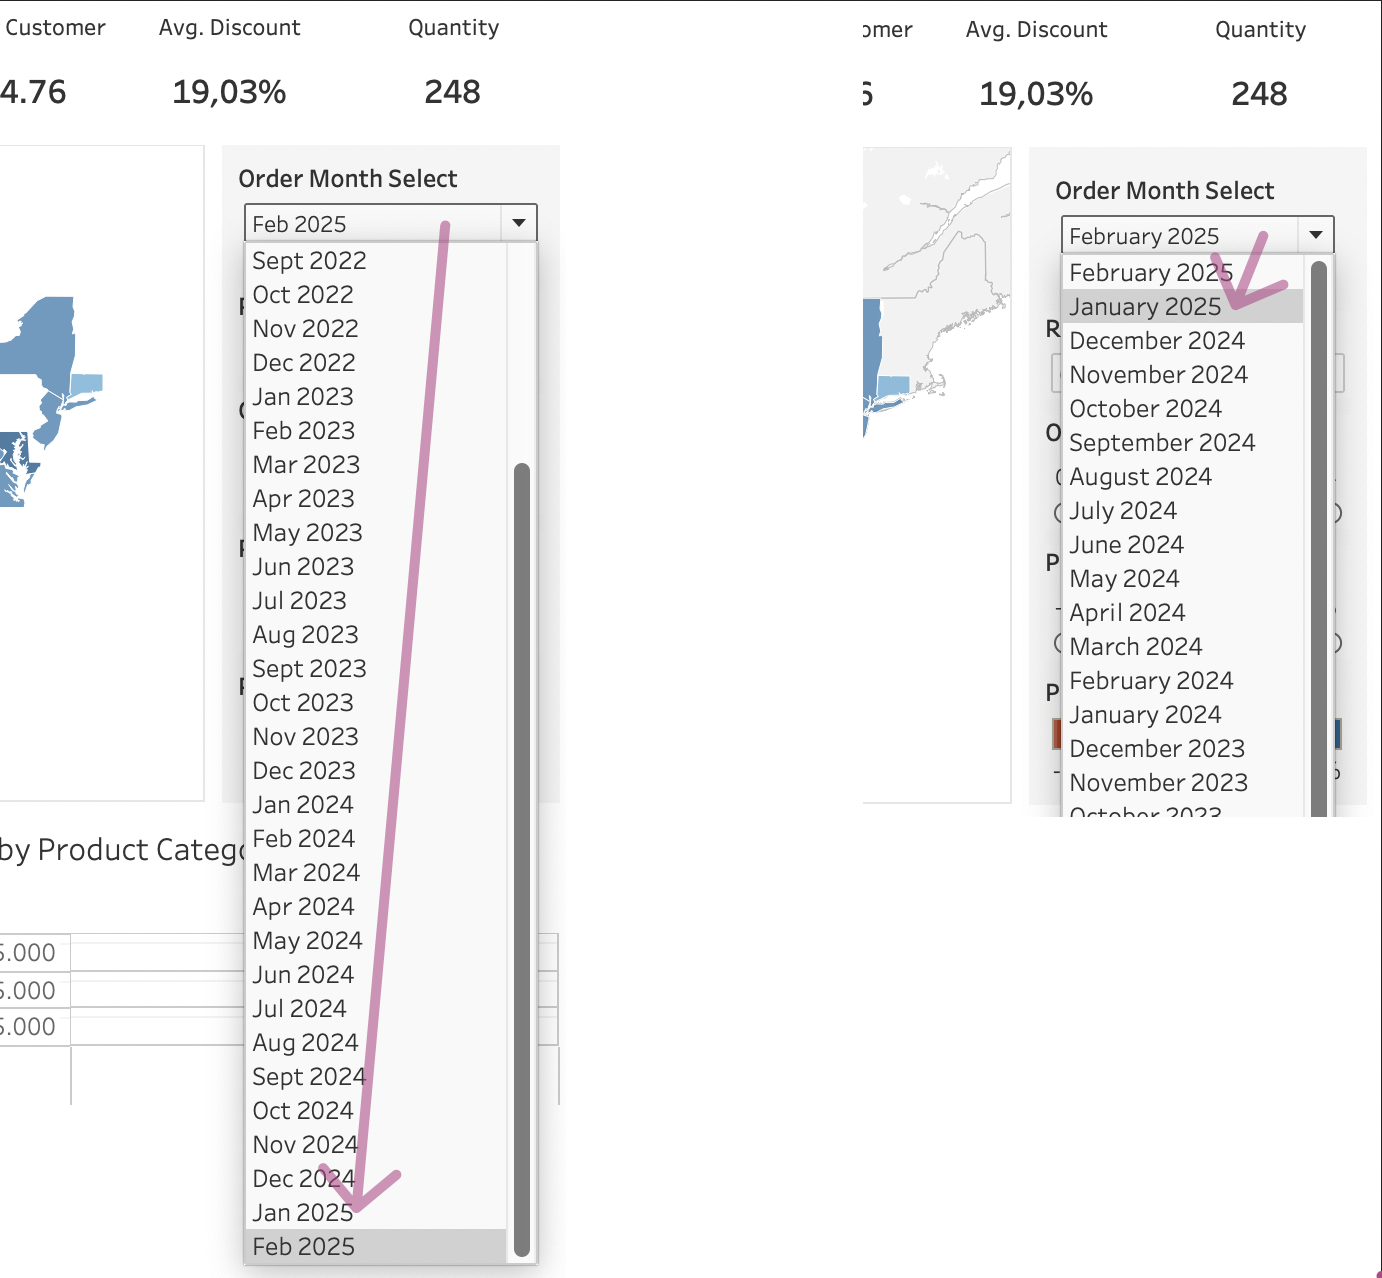
If you create a drop-down filter or parameter for dates, the selected date (this month) is usually on the bottom of the list. This has the implication that if you want to select previous month, you have to select the value which is pretty ‘far away’ from the filter.
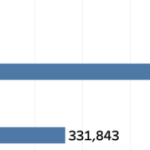
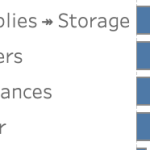
Compare the distances between previous month (much more common than selecting a month from three years ago) in the default way (left) and with the months sorted descending (right):
A date-filter can’t be sorted descending in Tableau (as far as I am aware of), but a parameter can be used for a filter, and has some nice features.
The base elements of this solution are a parameter for the interaction, and a set for the filtering. On top of these we need some extra calculations to make it work, and/or make it even better:
Two calculated fields: the list of months and the default selected month
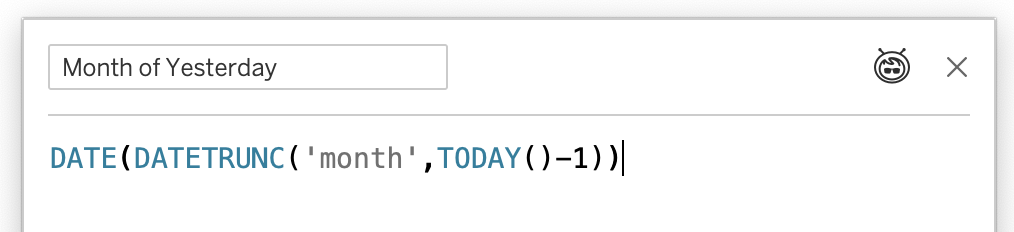
Create a calculation which returns on the first day of the month
The ‘DATETRUNC’ function is perfect for this. Add an extra ‘DATE’ function around the calculation, otherwise it results into to datetime field – and we only need the date (this is also better on performance)
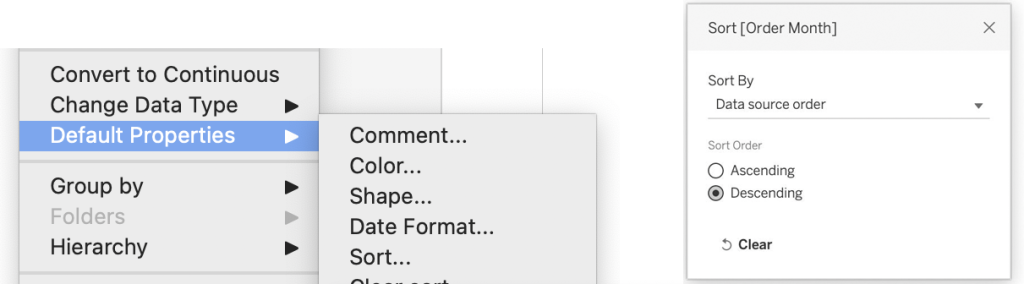
Set the default sort of this new calculation to ‘Data source order – Descending’
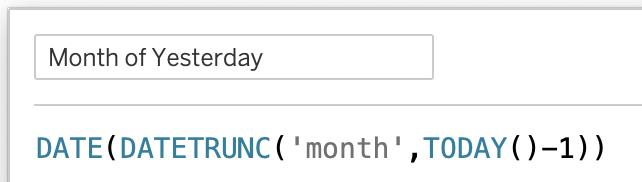
Create an extra ‘helper’ calculation which returns the month of the date of yesterday – this will be the default value for the parameter:
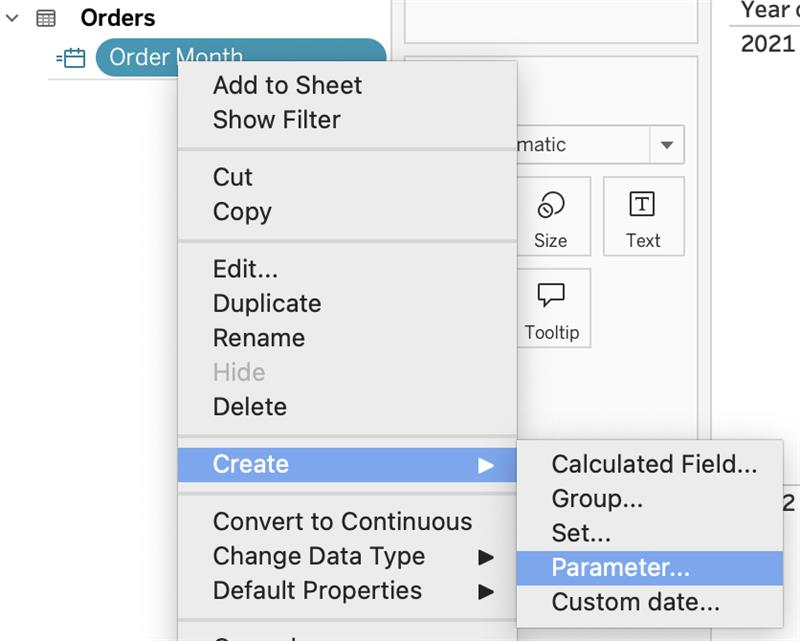
Create parameter based on newly created field
Because you just set the sort order for this month from the most recent month to the least recent one, the parameter is automatically sorted the way we want it.
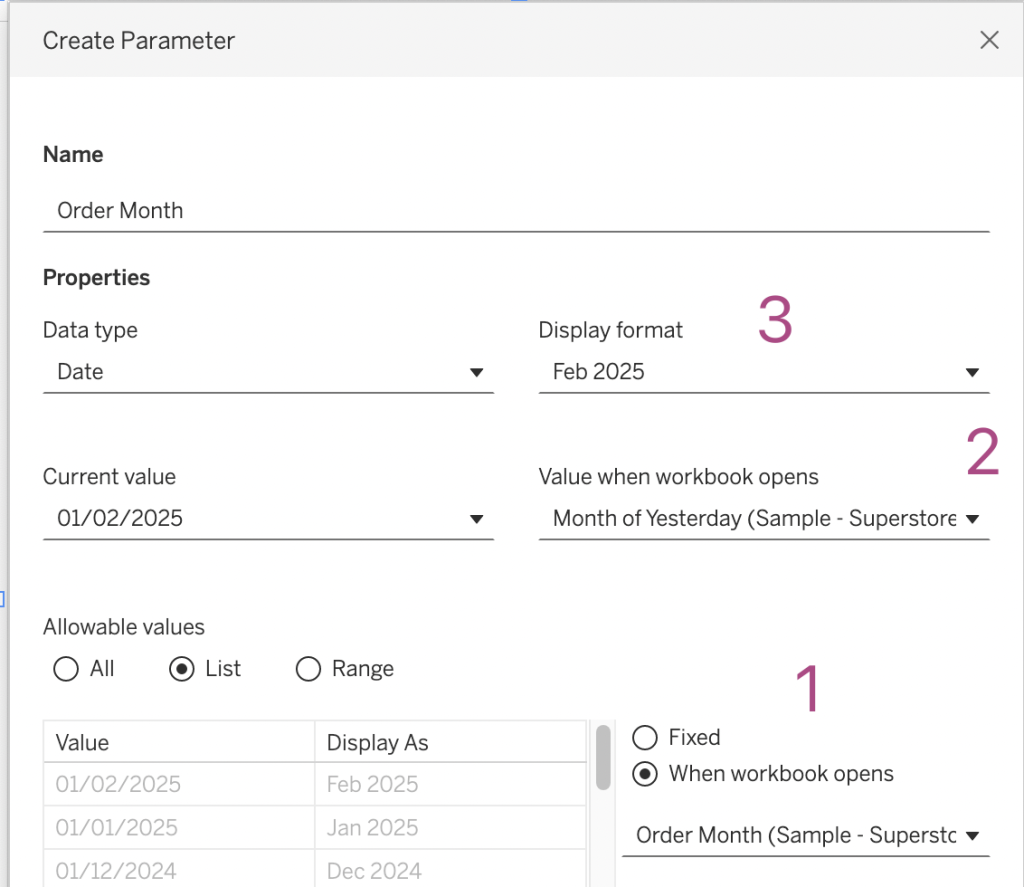
The configuration of this parameter is important:
- “When workbook opens”: select to the calculated field you created first. This makes sure all months available in the dataset will be used in the parameter, each time you open your workbook.
- “Value when workbook opens”: here we use that second calculated field, so the most recent date will be selected when opening the dashboard
- “Display Format”: set it to ‘Custom Format’ – ‘MMM yyyy’ to show the month/year combination, instead of the first date of the month.
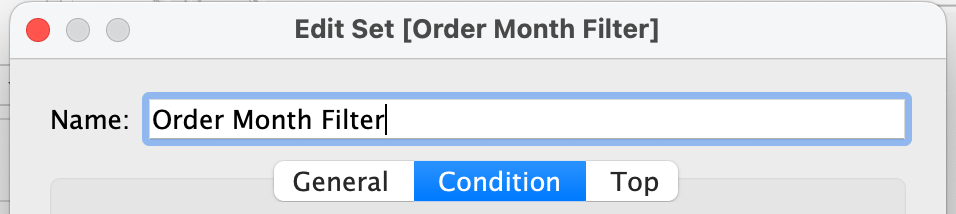
Setting up the filter
Now we create a filter based on the parameter. You can also use a ‘normal’ calculation for this, but sets can be more useful since they are quite high in the order of operation.
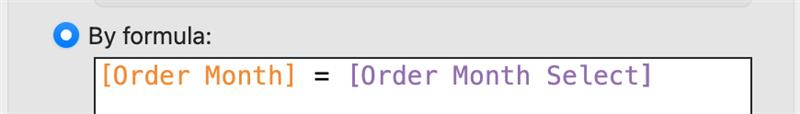
Right-click on the ‘Order Month’ calculation, and create a small calculation on ‘Condition’ – ‘By formula’. This returns ‘true’ when the current month is equal to the parameter value (or more precise: the month of yesterday is equal to the parameter)
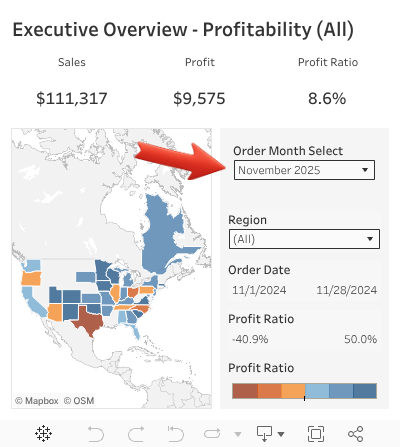
Drag the newly created set to the filter-shelf, and add the parameter to your dashboard.
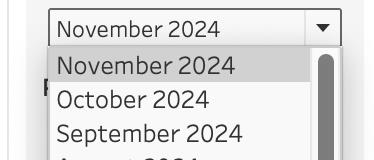
Use the drop-down to ‘feel’ how easy it is to switch the previous month:
It’s a really small change to your dashboard – but one which makes interacting with the data easier.