Getting data from external APIs into Tableau often involves several workarounds —manual extracts, middle-ware scripts, or writing to a database. This isn’t bad per se, but if you just want real time data from an API, Table Extensions are a clean and direct solution.

Table Extensions allow you to connect Tableau directly to external data sources like APIs using Python, R, or other analytics engines. This means you can fetch live data—whether it’s weather updates, currency exchange rates, or stock prices—and use it as if it were a regular data source in Tableau.
In this post, I’ll walk you through how to set up your first Table Extension, use Python to pull live data (without storing anything), and explore the benefits and best practices of using this approach—especially when working with real-time or short-lived data.
Table Extensions – don’t get confused…
Tableau has a problem regarding naming extensions…
Table Viz Extensions…
When creating a dashboard or sheet you can use dashboard and viz extensions to create your own viz using JavaScript, including the Tableau Table Extension to create an advanced table in an easy way.
On the data source side, you have also something called the Tableau Table Extension, which is completely different from the viz Extension.
Using the Table Extension it is easy to fetch data from an external data source like an API, and use it as a data source table for your visualization.
Python in Tableau using Tabpy
To make this all work it is necessary you have your own Tabpy instance, either local or on a server. This application allows for the remote execution of Python code. Documentation on how to install and configure Tabpy can be found at https://tableau.github.io/TabPy. There are several options, like Docker and Python virtual environments.
For testing purposes you can just run it on your local computer with no added encryption or authentication. If you are going to run it on a production environment please take a very good look at performance, infrastructure and underlying security!
‘Hello world’: first table extension script
Just to make sure everything works, we create a small Python script which returns the current time for all time-zones in the world. No data or request is sent out on this script.
import pandas as pd
from datetime import datetime
import pytz

# Get all timezones
timezones = pytz.all_timezones

# Create a list of dictionaries with timezone and current time
data = []
for tz in timezones:
    timezone = pytz.timezone(tz)
    current_time = datetime.now(timezone).strftime('%Y-%m-%d %H:%M:%S')
    data.append({'timezone': tz, 'current_time': current_time})

# Create a DataFrame
df = pd.DataFrame(data)

# Return the DataFrame to Tableau as a dict
return(df.to_dict(orient='list'))
This code is pretty basic Python. Tableau ‘expects’ data in a specific way, therefor we convert the Pandas dataframe to a dict at the end
Use the code in Tableau
A step-by-step method to get the data as a live datasource in Tableau – follow along with the video below:
- Connect to a random datasource – Tableau Table Extensions need always toi be used in combination with a different datasource, although you don’t need the data from it. Just use a simple Excel datasource, like Superstore.
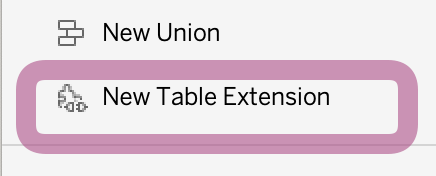
- Don’t drag any sheet of the Excel file to the datapane, but drag ‘New Table Extension’ to the pane
- Copy/past the python code in the code editor on the right
- Check if the script return data by clicking ‘Apply’ – the column names should appear at the bottom.
- Go to your sheet, change the properties of the fields as needed (e.g. convert ‘current_time’ from string to ‘Date & Time’
- Drag timezone to the rows, add current_time to Text, change this to ‘Exact Date’
- Look at all those beautiful timestamps from all over the world
- And if you refresh (F5, Ctrl-R) the dashboard, the script runs again, and the new timestamps appear – proof the datasource is running live data!
Taking this further: Real-time Weather Forecast
After running your first Python Analytics Extension within Tableau you can think of all the data you want to connect to. A ‘logical’ datasource is a weatherservice: if you open a dashboard the latest data is needed, but you might not want/need to store all this data into a data base
Openweathermap has a very well documented API which can be used for free for the first 1.000 calls per day – usually sufficient for a small project.
I created a script which fetches the current weather forecast in JSON format, and then converts it into a data-format as expected by Tableau.
Along the way I convert some columns (e.g. to percentages) and added some columns (Celsius and Fahrenheit units for all temperatures, image role for weather icon, etc).
The code can be found here: https://gist.github.com/antichaos/7e406d1d7597759ba28a1b687103ea3a=
Implementation Steps
- Register for an account on OpenWeathermap , create an API key, and use this key in the code.
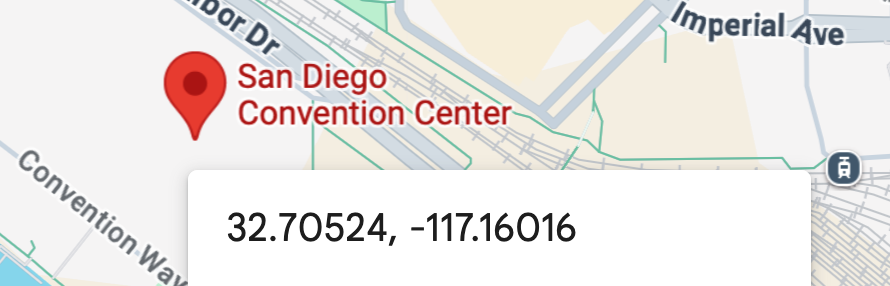
- Change the location name, longitude and latitude in the code. Tip: in Google Maps you can just right-click in the map, and the longitude and latitude are shown
- Copy this code, and use this using exactly the same steps as described above.
- Create a dashboard using this realtime data, which gets updated every time you open the dashboard!
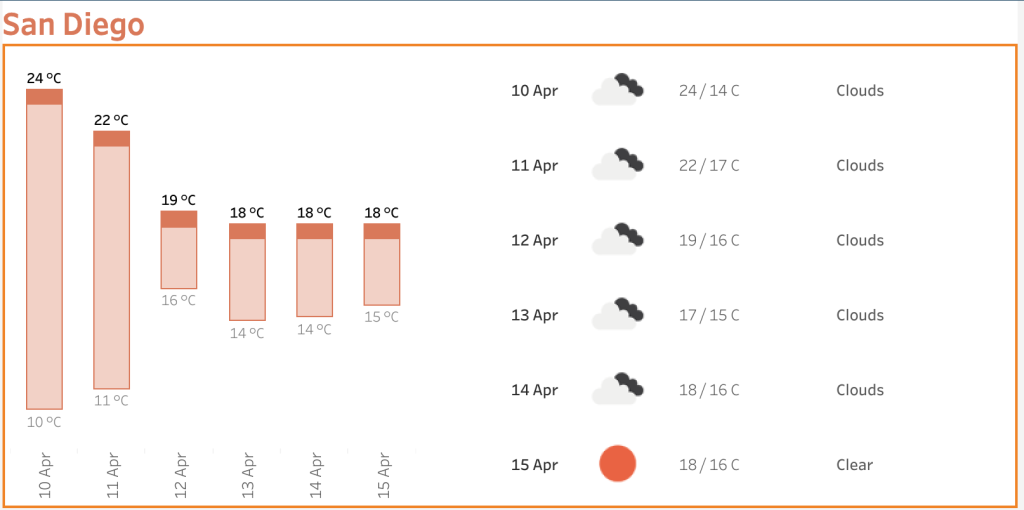
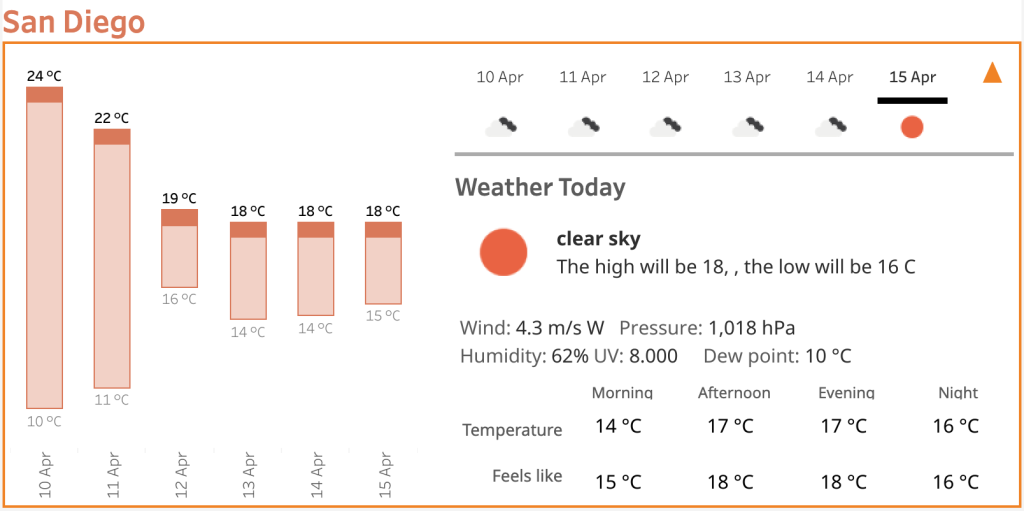
The Result
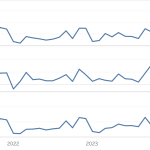
Unfortunately Table Connections are not supported on Tableau Public, so I will show you the result of a small dashboard I created based on this data:
Sidenotes
- Not always the best solution: Only use Table Extensions for realtime / short lived data. It is of no use to ‘build’ a dataset by querying a API using Tabpy; storing data into a file or database is much better maintainable and flexible.
- Other programming languages: Table Extensions are not limited to Python. You can use R (using RServe) or any other tool via the Analytics Extensions API, but the Python/Tabpy solution is the most common one
- Performance: TabPy is ‘single threaded’ – it can do only one thing at a time. If you want to use TabPy in a larger production environment you might want to scale by adding instances, and/or use better hardware.
- Caching: If thousands of users are going to use your realtime dashboard, not only the performance is important to take into account, but possibly also the the cost of running. Caching responses – either filebased r service based, like memcache – is good for three reasons:
- Cost: every API call might cost money, avoiding calls is cheaper
- Friendly use: Many APIs are free, but cost many to
- Performance: every locally stored data is faster then local.
Next Steps
Table Extensions unlock a wide range of new possibilities. Real-time shipping status, customer churn prediction models, LLMs to summarize data, Triggering Actions in External Systems, etc.
If you’re curious to dive deeper into what Table Extensions can unlock for your Tableau dashboards, start by identifying a use case in your current workflow where direct API integration could add value.
Table Extensions can help you build smarter, more dynamic dashboards.