• Skip to primary navigation
  • Skip to main content
Antichaos

Antichaos

Tableau, Data Analyse & Visualisatie

  • Home
  • Consultancy
  • Training
  • Blog
  • Showcase
  • About Me
  • Newletter
  • Contact
  • Show Search
Hide Search

Top 2000 visualisation – edition 2020

Johan de Groot · 4 January 2021 ·

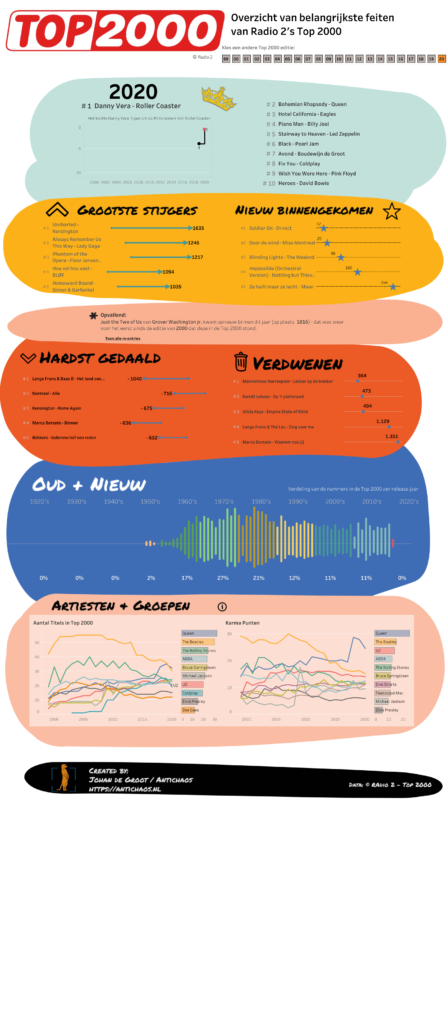
The Top 2000 edition of 2020 isn’t a fancy data visualisation with extensive data-preparation and/or mathematical formulas like last year, but a visualisation with the emphasis on what you can do with relative simple graphical elements. This approach can change the look and feel of a ‘standard’ dashboards significantly

Click on the screenshot to view – and use! – the data visualisation fullscreen.

Related posts:

Top 2000 van Radio 2 – Editie 2021 De Top 2000 van 2022 gevisualiseerd The Radio Top 2000 visualised – edition 2022 Better datefilters in Tableau

blog-en, blog-nl, Tableau, Top 2000 Top 2000

Need help?

Contact me if you need Tableau help on development, implementation or training!
contact@antichaos.net

The Antichaos Update

Like what you’re seeing? Let’s stay in touch!

(The Antichaos update is a short, infrequent newsletter on data, Tableau, usability and more!)

Follow me on LinkedIn

Follow me (and connect!) on LinkedIn to stay up-to-date. Connect on LinkedIn

Antichaos

Copyright © 2025