Datefilters are one of the most common filters on any dashboard. They are needed to see trends, make decisions on the right period, and analyse within the right context. But most of the times these filters are not optimal – so let’s make them better (and prettier)
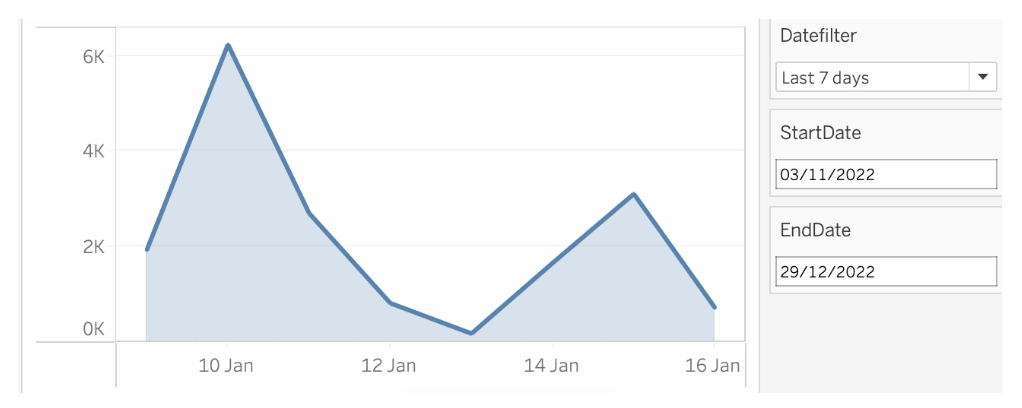
[Read more…] about Better datefilters in Tableau