Datefilters are one of the most common filters on any dashboard. They are needed to see trends, make decisions on the right period, and analyse within the right context. But most of the times these filters are not optimal – so let’s make them better (and prettier)
Daterange filter: often used, often not useful
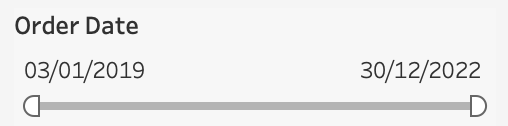
The most common used type of this filter is probably the date-range – but that’s most of the time not the best one:
- The slider seems useful, but it is hard to use for users; either with a mouse or their fingers (on phone or tablet).
- It’s not easy to select exact dates – usually ‘first of the months’, ‘first of the week’, etc
- Tableau doesn’t offer a good default: it’s either ‘first date to last date’, or a predefined period which doesn’t change with new data (or dates)
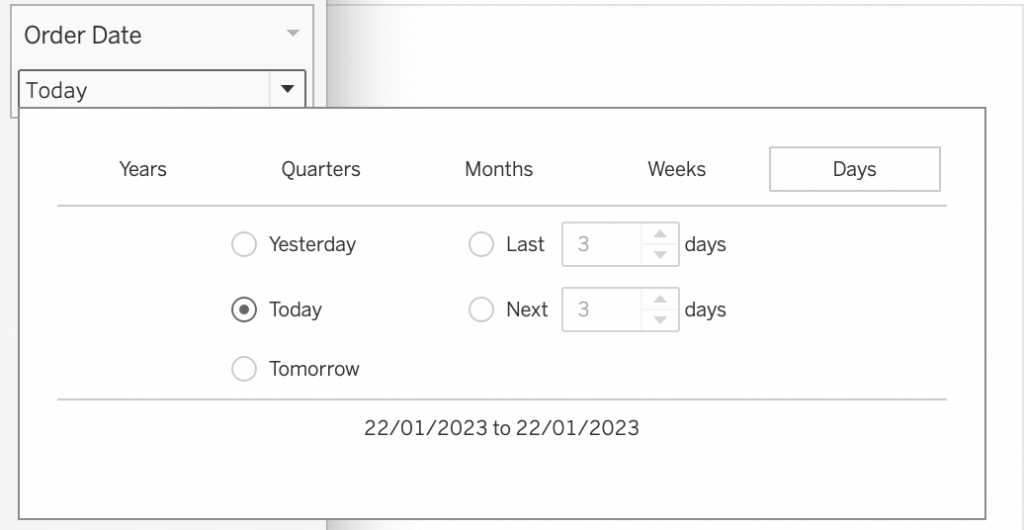
Relative Date filter
A ‘logical’ replacement of the slider would be the relative date filter. But this has its own issues: its not very intuitive, the ‘Next n days/weeks/…’ option is most of the time confusing, and you can’t set a custom daterange.
Let’s create a better datefilter!
Date filter with Parameters
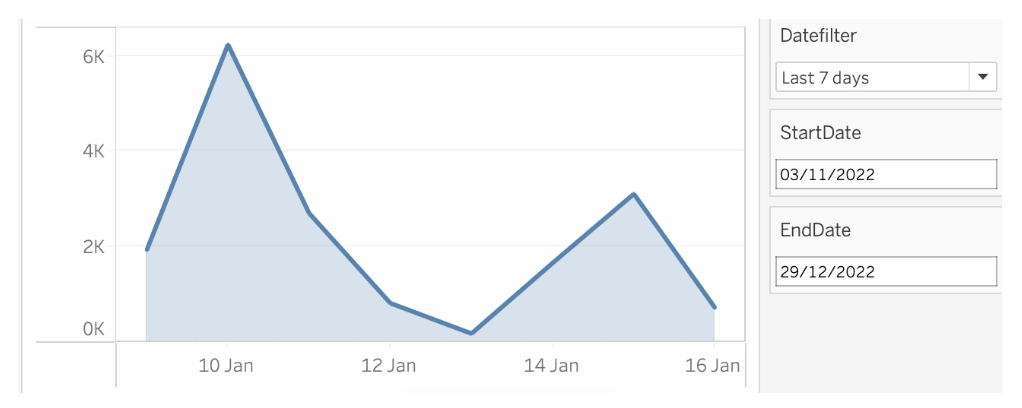
A better way is using parameter (or actually multiple parameters). This parameter shows all ‘default’ options (e.g. last week, last month, previous 10 days, … ) – plus an option for a custom date range. In this example I used 5 different fixed periods plus a custom period – but use as many periods a you like/need:
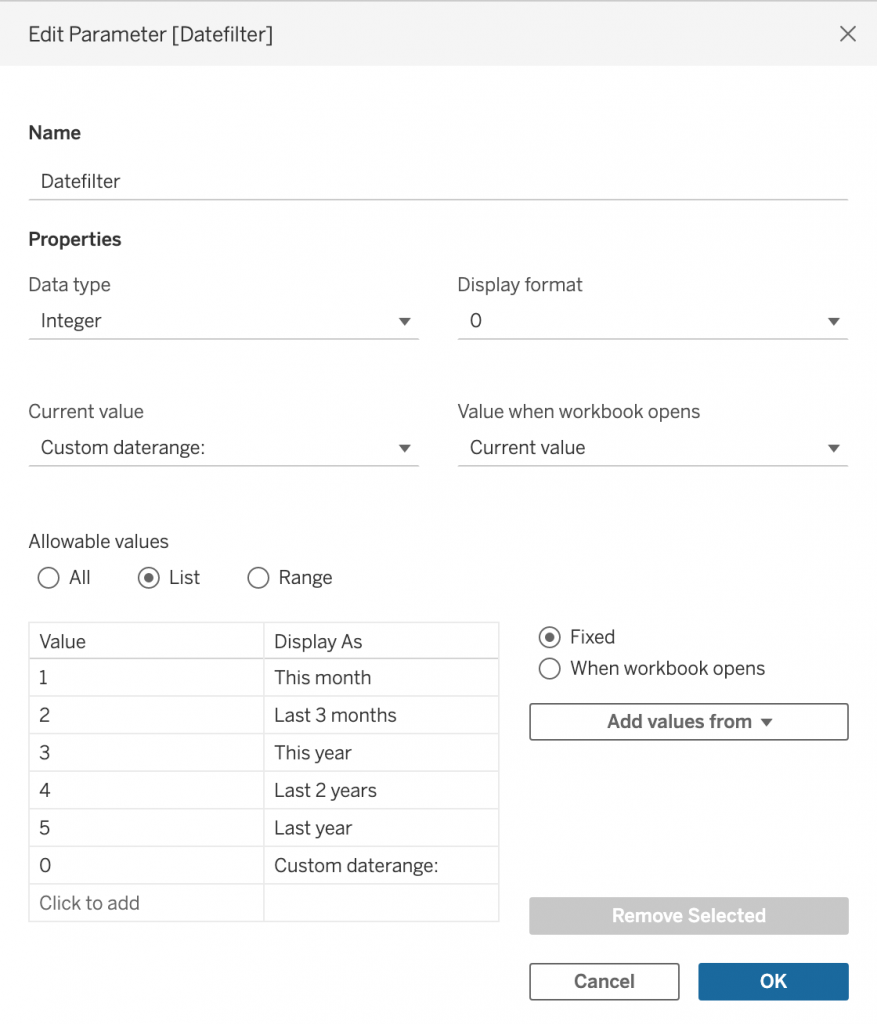
I used an integer for the values, so I can easily change the naming (‘Display As’) without needing to change calculated fields which use this parameter, but a string can work evenly well.
Then create two extra parameters with datatype ‘Date’: StartDate and EndDate – these are needed for the custom date ranges.
Calculated fields as filter
A parameter is just a value – you have to use it in a calculation to make it work. Create two calculated fields to assign the right date-periods to each parameter-value (you can use just a single calculated field, but splitting start and end date is useful for formatting – this will be explained below)
[Datefilter (startdate)]
CASE [Parameters].[Datefilter]
// last 7 days
WHEN 1 THEN
[Order Date] >= DATEADD('day',-7,TODAY())
// this week
WHEN 2 THEN
[Order Date] >= DATETRUNC('week',TODAY())
// last week
WHEN 3 THEN
[Order Date] >= DATETRUNC('week',TODAY()-7)
AND [Order Date] < DATETRUNC('week',TODAY())
// this month
WHEN 4 THEN
[Order Date] >= DATETRUNC('month',TODAY())
// last month
WHEN 5 THEN
[Order Date] >= DATETRUNC('month',DATEADD('month',-1,TODAY()))
AND [Order Date] < DATETRUNC('month',TODAY())
// year to date
WHEN 6 THEN
[Order Date] >= DATETRUNC('year',TODAY())
WHEN 0 THEN [Order Date] >= [StartDate] AND [Order Date] <= [EndDate]
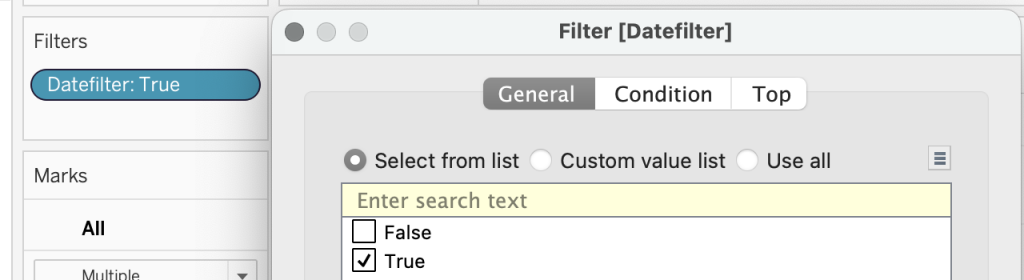
ENDDrag this newly created calculated field to the filter-shelf, and keep the ‘True’ values:
The result
If you have applied this on a trend-line (like order-date vs sales), you can easily switch between periods, or choose a custom dateperiod:
Next: Making it prettier
The functionality is ok – but this can be done better:
- A lot of space is now dedicated to the 3 parameters
- It is hard to see the actual date period
- The start and end-date parameters are always visible, while they are only needed when using the custom date range
- The three parameters take up too much space in a dashboard
- And more…
This will be discussed in the next blogpost on this series!