• Skip to primary navigation
  • Skip to main content
Antichaos

Antichaos

Tableau, Data Analyse & Visualisatie

  • Home
  • Consultancy
  • Training
  • Blog
  • Showcase
  • About Me
  • Newletter
  • Contact
  • Show Search
Hide Search

Antichaos Blog

Moving Skylines of the World

Johan de Groot · 20 January 2021 ·

Showing the Skylines of cities in Tableau – one by one.

[Read more…] about Moving Skylines of the World

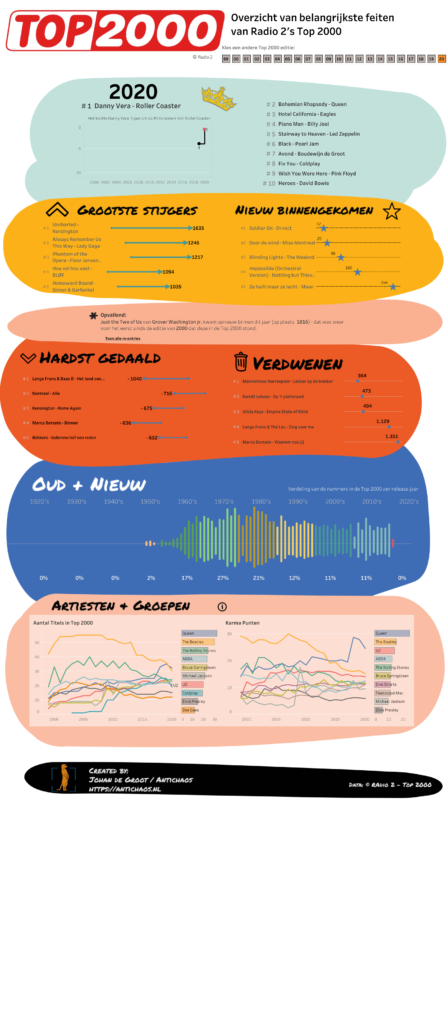
Top 2000 visualisation – edition 2020

Johan de Groot · 4 January 2021 ·

The Top 2000 edition of 2020 isn’t a fancy data visualisation with extensive data-preparation and/or mathematical formulas like last year, but a visualisation with the emphasis on what you can do with relative simple graphical elements. This approach can change the look and feel of a ‘standard’ dashboards significantly

Click on the screenshot to view – and use! – the data visualisation fullscreen.

Top 2000 visualisatie – editie 2020

Johan de Groot · 4 January 2021 ·

(In Dutch) Voor de editie van 2020 heb ik dit keer niet gekozen voor een extreem fancy datavisualisatie met uitgebreide data-preparatie en/of ingewikkelde wiskundige formules, maar wat meer nadruk gelegd over hoe je met relatief eenvoudige grafische elementen je een dashboard een compleet ander uiterlijk kunt geven dan een ‘standaard’ dashboard.

[Read more…] about Top 2000 visualisatie – editie 2020

Map Layers in Tableau – step by step (or layer by layer)

Johan de Groot · 30 December 2020 ·

The Tableau 2020.4 release comes fully-loaded with tons of great features, including several key updates to boost your geospatial analysis. In particular, the new multiple marks layers feature lets you add an unlimited number of layers to the map. This means you can visualize multiple sets of location data in context of one another, and there’s no need for external tools to build custom background maps. 

[Read more…] about Map Layers in Tableau – step by step (or layer by layer)

Comments in Tableau

Johan de Groot · 16 November 2020 ·

When you are creating a calculated field in Tableau Desktop, Server of Prep you might want to create some comments to help others see what the purpose of this field is, or explain the calculation that you made. In other situations you might want to test a line of code, and disable a previously written block of code without deleting it.

This is all possible using comments in calculated fields.

[Read more…] about Comments in Tableau
  • « Go to Previous Page
  • Page 1
  • Interim pages omitted …
  • Page 11
  • Page 12
  • Page 13
  • Page 14
  • Page 15
  • Interim pages omitted …
  • Page 18
  • Go to Next Page »

Antichaos

Copyright © 2025