• Skip to primary navigation
  • Skip to main content
Antichaos

Antichaos

Tableau, Data Analyse & Visualisatie

  • Home
  • Consultancy
  • Training
  • Blog
  • About Me
  • Newletter
  • Contact
  • Show Search
Hide Search

blog-en

Better datefilters in Tableau

Johan de Groot · 22 January 2023 ·

Datefilters are one of the most common filters on any dashboard. They are needed to see trends, make decisions on the right period, and analyse within the right context. But most of the times these filters are not optimal – so let’s make them better (and prettier)

[Read more…] about Better datefilters in Tableau

The Radio Top 2000 visualised – edition 2022

Johan de Groot · 10 January 2023 ·

I visualized the Top 2000 as broadcast by Radio 2 for the 11th time (I believe) in a different way using Tableau.

[Read more…] about The Radio Top 2000 visualised – edition 2022

Weather Forecast in Tableau

Johan de Groot · 7 September 2021 ·

The most talked about topic in the world is probably the weather. And if you want to talk about, you need to know the data 😉

This dashboard show the weather forecast in my location for today and the next 4 days.

[Read more…] about Weather Forecast in Tableau

Moving Skylines of the World

Johan de Groot · 20 January 2021 ·

Showing the Skylines of cities in Tableau – one by one.

[Read more…] about Moving Skylines of the World

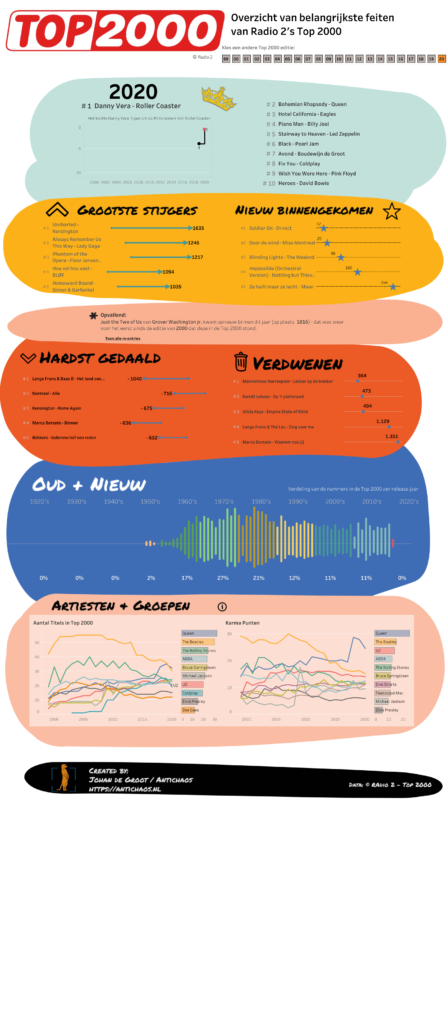
Top 2000 visualisation – edition 2020

Johan de Groot · 4 January 2021 ·

The Top 2000 edition of 2020 isn’t a fancy data visualisation with extensive data-preparation and/or mathematical formulas like last year, but a visualisation with the emphasis on what you can do with relative simple graphical elements. This approach can change the look and feel of a ‘standard’ dashboards significantly

Click on the screenshot to view – and use! – the data visualisation fullscreen.

  • Page 1
  • Page 2
  • Page 3
  • Go to Next Page »

Antichaos

Copyright © 2025