The June 2024 release of the Hyper API (version 0.0.19484) is available – and it now finally supports Apple Silicon!

Johan de Groot · ·
The June 2024 release of the Hyper API (version 0.0.19484) is available – and it now finally supports Apple Silicon!

Johan de Groot · ·
It’s just a couple of weeks before TC24 in San Diego… So we want to know what the weather is out there!

Or at home. Or any other place in the world.
What better than building your own weather forecast in Tableau!?
Johan de Groot · ·
The ‘shapes’ functionality in Tableau is a nice way to enhance and personalize a visualization. But be aware what exactly you are decoration – especially on maps.

Johan de Groot · ·
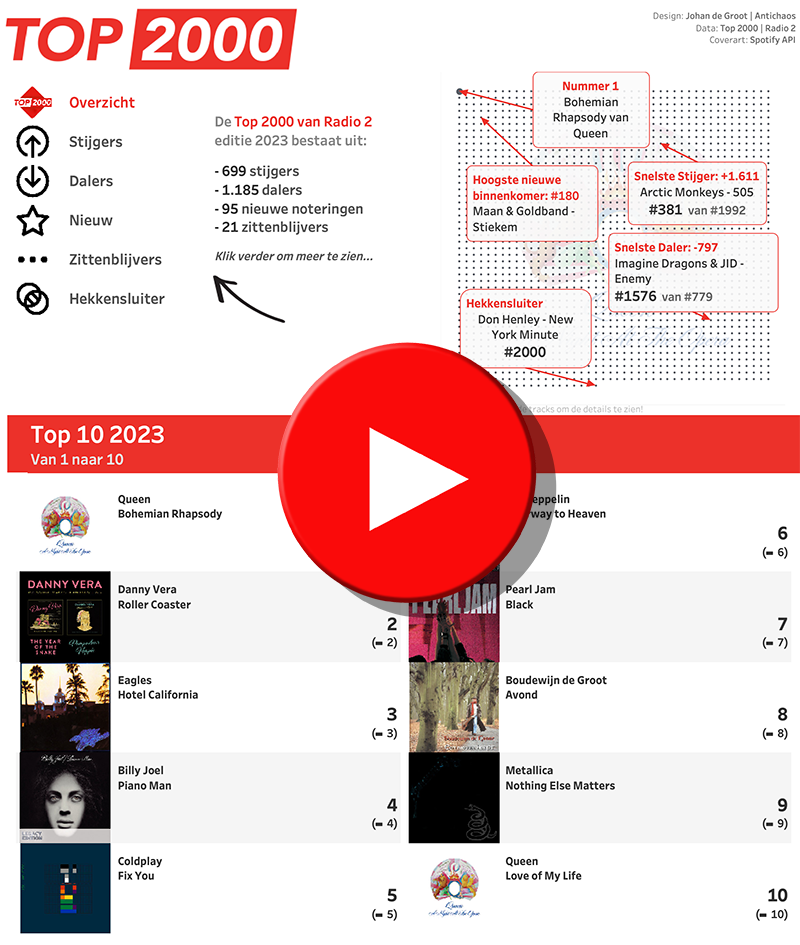
The Top 2000 of Radio 2 (a populair Dutch radio station) has been broadcast for the 25th time – and traditionally I am trying to turn this into a ‘different’ interactive data visualization…

Johan de Groot · ·
Labels are often an after-thought for many users – we don’t like them, but are necessary. Using some simple steps we can create better labels which are easier to interpret for the users of the dashboard.

[This blogpost is part of a series tips tricks, as being presented at VizIt Berlin 2023]
