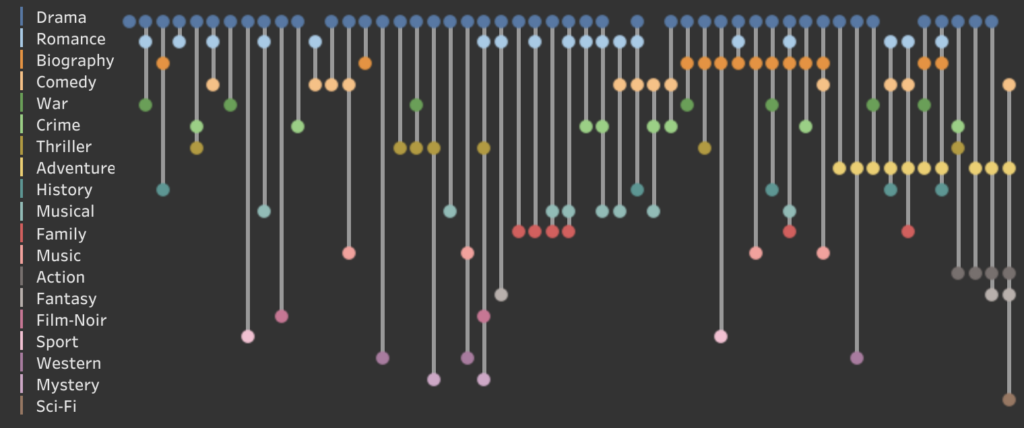
Using the great dataset ‘Data and Movies‘.- with lots of IMDB data from movies until 2022 – I created a dashboard about the different Genres of Academy Award Winners for Best Picture.

Genres using an upset plot
During a nice talk at Measurecamp Amsterdam (a digital analytics unconference) I was re-introduced to the “UpSet plot” – an alternative chart-type to a venn-diagram. A venn-diagram is only readable for 2 to 4 elements, the upset plot can handle more elements much more elegemant.
The genre of a movie is a typical use-case for this: a single
(Link to dashboard on Tableau Public)
