Ever wanted to count up or down in Tableau?
Now you can using the CountTo Viz Extension – for free!
Using this extension a dashboard will count up or down to a certain value.
History
One of my clients asked for an animated measure on a sustainability dashboard. I immediately dismissed the idea of being ‘not useful’ and not ‘best data visualization practice”…
But the idea stuck into my mind, and I was wondering if it was possible within Tableau.
I have created Tableau dashboard extensions before (read also my post on the Tableau Community blog on this), but was wondering if the newer viz extensions would be better suited for this. Looking into the technical documentation I noticed the technical approaches of both dashboard and viz extensions are very similar, but the viz extension are more user friendly for my use case.
Because Tableau extensions are ‘just’ JavaScript, I searched for similar counter functionalities using that language, and found the pretty CountUp.js. I was able to combine their code inside the Tableau Viz extension structure. quite easily. It took me (as a non-JavaScript programmer) a bit longer to get my idea fully implemented, including all kind of user-configuration, but I managed to do it with the current result in the CountTo Tableau extension in ‘beta’.
After some ‘sneak previews’ at the NLTUG and Datafam it’s time anyone can use it!
Demo
The screen recording on top of this article shows a ‘simple’ counter, with some changes to the font and color.
Within the configuration of the extension you can change the formatting (currency, percentage, people, … ) and many more features. This is a rework of the standard Superstore dashboard, but now with CountTo BANs:
The extension doesn’t work on Tableau Public, so I can’t publish a live version. But you can try the extension yourself (it is and will stay for free), or download the sample workbook and use it yourself in Tableau Desktop.
Usage
It is really easy to add an animated counter to your dashboard:
- Download the Trex file: https://extensions.antichaos.net/CountTo/countTo.trex
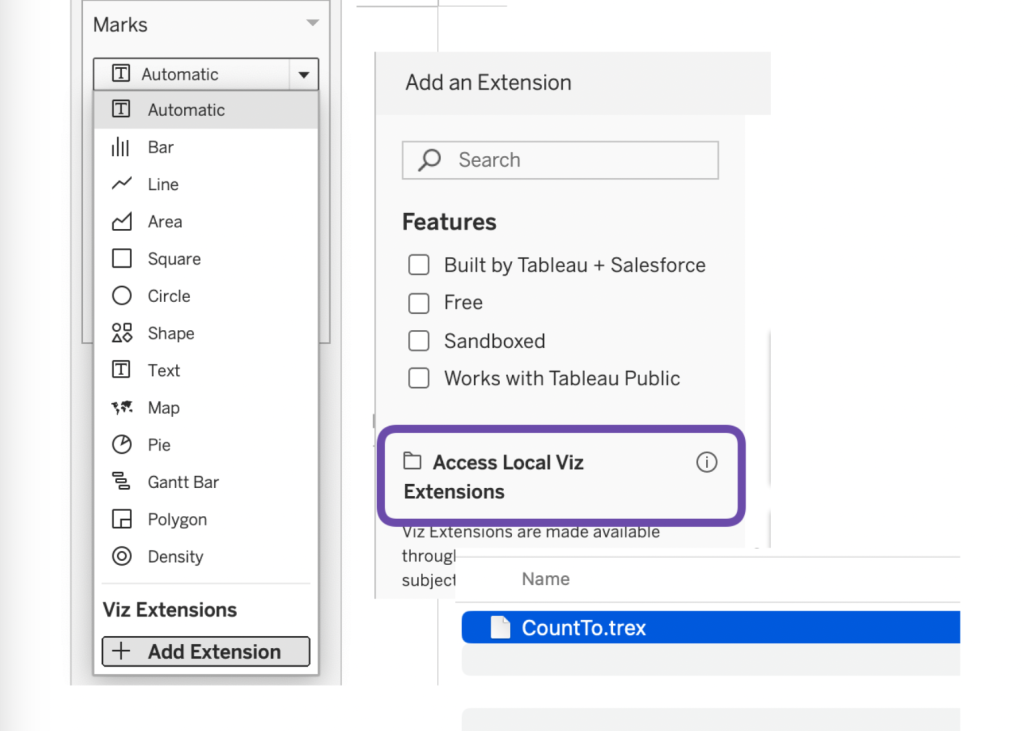
- Open your Tableau workbook, select ‘Viz Extensions’, ‘Add Extension’, ‘Access Local Viz Extensions’, and select the .trex file you just downloaded
- Allow usage of the extension in Desktop (the extension doesn’t read any of your data except the measure you want to visualize, and even that value doesn’t leave your browser)
- Drag a measure to ‘Measure’
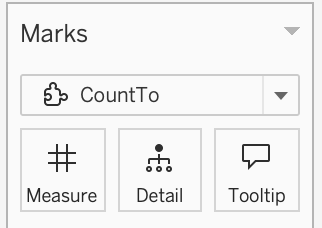
- And you are done!
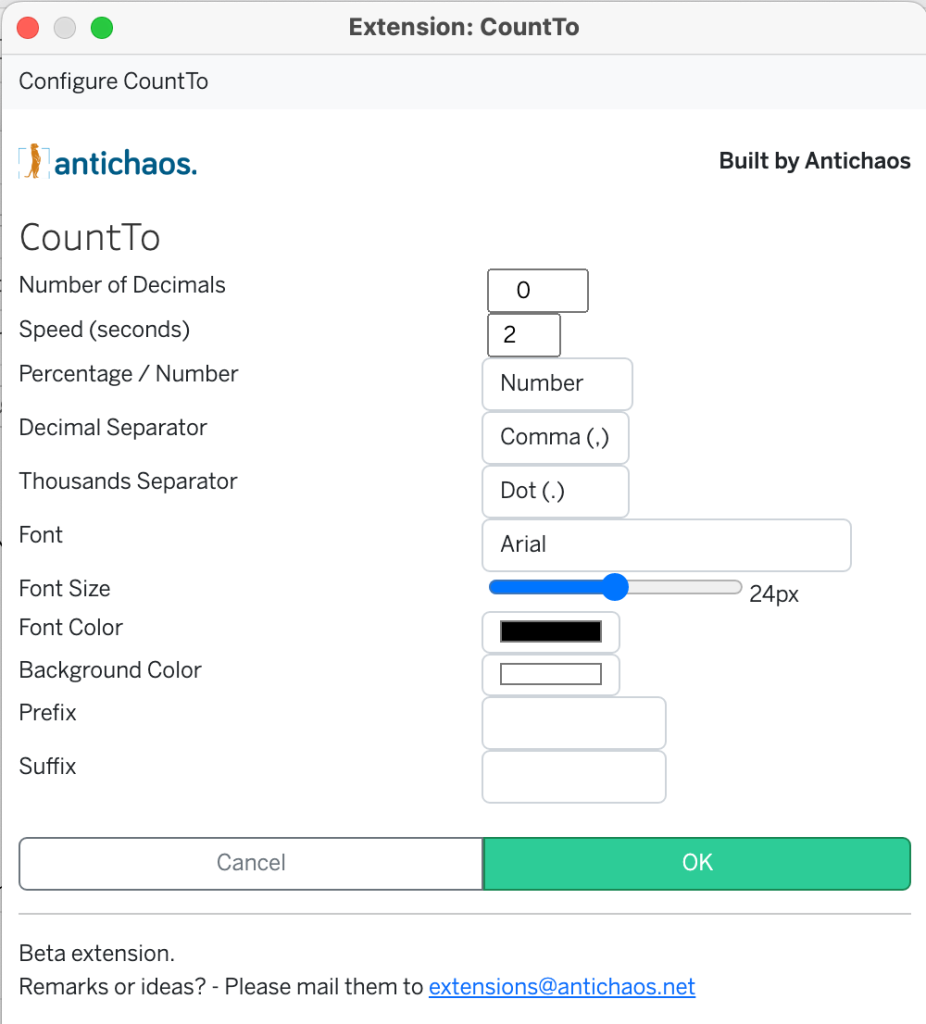
If you want to change the behavior of the counter, open ‘Format Extension’, and change whatever you want: number format, font, color, background color, prefix, .. .
Important: if you want to use this extension on Tableau Server or Tableau Cloud you need to whitelist the URL “https://extensions.antichaos.net/CountTo/” on the admin page!
Test the extension yourself!
I have created a sample workbook with the aforementioned examples. Download the workbook, allow the usage, and see how the numbers go up and down.
Customization, own versions, ideas, bugs…
The current version is stable and very usable, but needs some cleanup. And The source code of the extension will be available very soon, so everyone can download the source code, and adapt it to your own liking.
If you have any question, suggestion, idea, wild thought, found a bug or just want to let me know you like it (or not), mail me at extensions@antichaos.net, so the CountTo extension will get better in next versions.
I have some ideas of my own for improvement and extra features, but I’m really interested in your ideas!