When people think of Tableau, they usually picture dashboards, visualizations, and drag-and-drop analytics. In this traditional setup, users explore data by interacting with dashboards: charts, filters, tooltips, etc. But what if you don’t need the visuals at all—just the data behind them, with all the same calculations, filters, and logic already applied?
That’s where the VizQL Data Service (VDS) comes in.
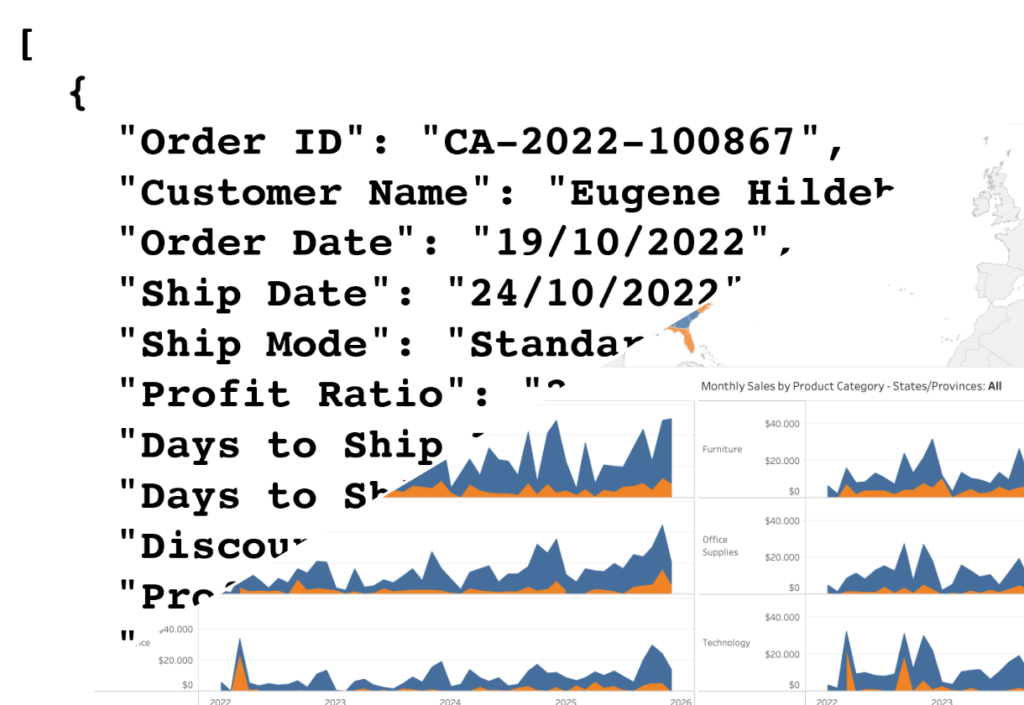
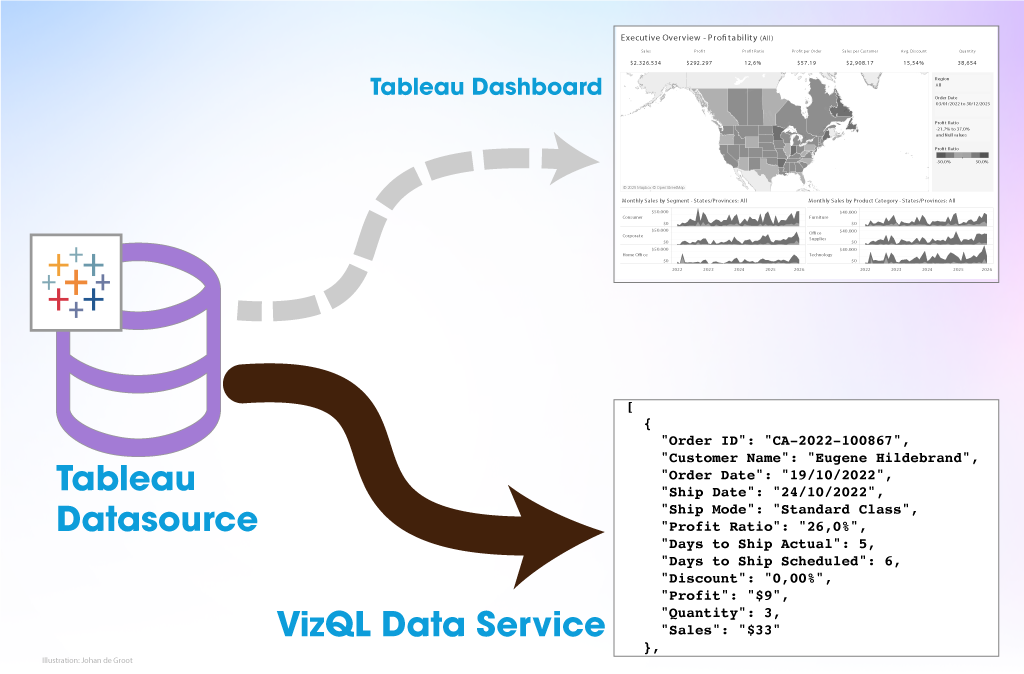
Rather than returning charts and visuals, it taps into Tableau’s VizQL engine to give you just the data behind any published view.. Instead of clicking through a dashboard, you can get the same data directly—like a spreadsheet or text file—by sending a simple request from another app or script.
In this post, we’ll explore what the VizQL Data Service is, what you can do with it, and how it fits into the broader Tableau ecosystem. A hands-on example is coming soon in a follow-up article!
What is the VizQL Data Service – and what is VizQL?
The core engine inside Tableau is VizQL. It translates what you build visually into efficient database queries—usually SQL. Then, it turns the results into visual elements like bars, lines, or maps. According to Tableau:
VizQL is a visual query language for databases
The VizQL Data Service is a way (not the language itself) to access the data behind a Tableau view, using the VizQL engine—without interacting with the dashboard visually. It lets you fetch the exact numbers behind charts or tables in a machine-readable format (like CSV or JSON).
Think of the VizQL Data Service as a method to get Tableau’s data via code, using the same logic and engine that powers your dashboards.
In short: the VDS lets you extract the exact data behind a Tableau view via requests — with all the calculations, filters, and logic already applied.
What Can You Do With It?
The VDS opens up all kinds of possibilities using the data:
Export Underlying Data Programmatically
You can fetch the full data from a datasource in formats such as CSV or JSON. This is useful if:
- You want to embed the same data elsewhere (like a web page)
- You’re automating reports that replicate Tableau’s logic.
The classic “Can I export this to Excel?” question can be answered with a custom export feature using VDS. - The data is useful for deep analysis, like machine learning
- You want to validate dashboard figures (as shown in Tableau—not just the raw database values).
Integrate Tableau Logic into Other Apps
- You’ve built a Tableau dashboard with carefully calculated KPIs—like monthly revenue growth, customer churn rate, or NPS scores.
Now you want to show those same metrics on your company intranet homepage or a custom analytics portal, without embedding the full Tableau dashboard. Use the VizQL Data Service to pull just the KPI numbers (e.g. “Revenue this month: €143K”) and display them as lightweight widgets in your custom web app. - Show KPIs on an internal TV/Digital Signage screen combined with non-Tableau widgets
- Build an agent or bot which returns the value of the latest monthly revenue by replying to
/kpi latest revenue
Data-driven events

- You can react to changes in your dashboard—for example, light up a signal lamp when the monthly sales target is hit!
- Trigger a Workflow – when a product’s stock falls below 100 units, a restock process is started via a webhook.
Data from the VizQL Data Service is essentially “just the data”—structured rows and columns, similar to what you’d get from any other dataset.
However, the big advantage lies in where it’s coming from: a curated Tableau datasource. That means the data already includes your business logic, filters, calculations, and permissions—just as defined in Tableau. This makes it much easier to work with trusted, consistent metrics across tools, without having to rebuild logic or replicate complex calculations elsewhere.
Pros and Cons of using VDS
Of course, the Tableau VDS is not an all-in-one solution for all your data problems. Here are some pros and cons to consider:
Pros
- Zero Duplication: No need to rebuild business logic or Tableau calculations elsewhere.
- Reliable Results: The VDS returns exactly what the dashboard shows.
- Flexible Output: Supports formats like JSON, CSV, and can be integrated into APIs, scripts, and apps.
- Secure: Honors user-level permissions and filters (like Row Level Security or parameter values).
- Unified access point: Query data from multiple underlying sources—databases, extracts, or live connections—through a single, consistent interface.
Cons
- It is not a general-purpose API: It’s designed for specific views, not for ad-hoc querying.
- Datasource-dependent: Any structural change to the Tableau datasource (like renamed fields) can break your VDS queries.
- Performance Overhead: Complex queries and/or fetching large data can take longer to render data through the VDS compared to direct database queries.
- Not all functionality is supported (yet): for example, Table Calculations aren’t currently available.
When Should You Use It?
Use the VizQL Data Service if you want to:
- Avoid rebuilding calculations and filters outside Tableau.
- Trust Tableau as your single source of truth.
- Embed trusted data into non-Tableau interfaces (screens, apps, or chatbots).
But avoid it if:
- You need real-time, ad-hoc data querying.
- Your use case involves Tableau datasources which often change.
Have a look at the other Tableau APIs on the Developer Portal—they offer additional options that can complement or work better than the VizQL Data Service. Or you might need to tap into the original datasource.
More Resources
Some other good resources on VDS:
- The API pages with all the documentation
- Extend Your Data Beyond Visualizations from Tableau on the VDS by Joe Chirilov.
- Great video “VizQL Data Service from Tableau: Use Your Data, Your Way” by Kyle Massey
- Exploring VizQL Data Service from Le Luu
Final Thoughts
The VizQL Data Service is a great new option for Tableau developers, non-Tableau developers, analysts, and engineers.
The best way to get started is by not diving into the technical details, but by downloading the data from a dashboard, and start imagining the possibilities of accessing that data programmatically.
It opens up a powerful new way to tap into Tableau’s query engine and logic—beyond the “usual” interactions on Tableau Server. Whether you’re embedding live metrics into other tools or experimenting with creative interfaces (stay tuned for a new way to display your Tableau data…), the VizQL Data Service gives you a flexible way to do more with your Tableau data—outside the dashboard.
Got wild ideas for the VizQL Data Service? Robots, bots, or KPI toasters—I’m all ears. Drop your thoughts in the comments: