• Skip to primary navigation
  • Skip to main content
Antichaos

Antichaos

Tableau, Data Analyse & Visualisatie

  • Home
  • Consultancy
  • Training
  • Blog
  • Showcase
  • About Me
  • Newletter
  • Contact
  • Show Search
Hide Search

dashboards

Letting Users Choose Their Visual

Johan de Groot · 3 July 2025 ·

A powerful way of creating flexible, user-friendly dashboards is by letting your users decide how they want to view the data. Instead of forcing them to view at a certain chart type, you can give them the option to chose between different visualizations- bar charts, line charts, etc, or variations on a chart, based on their need, or preference.
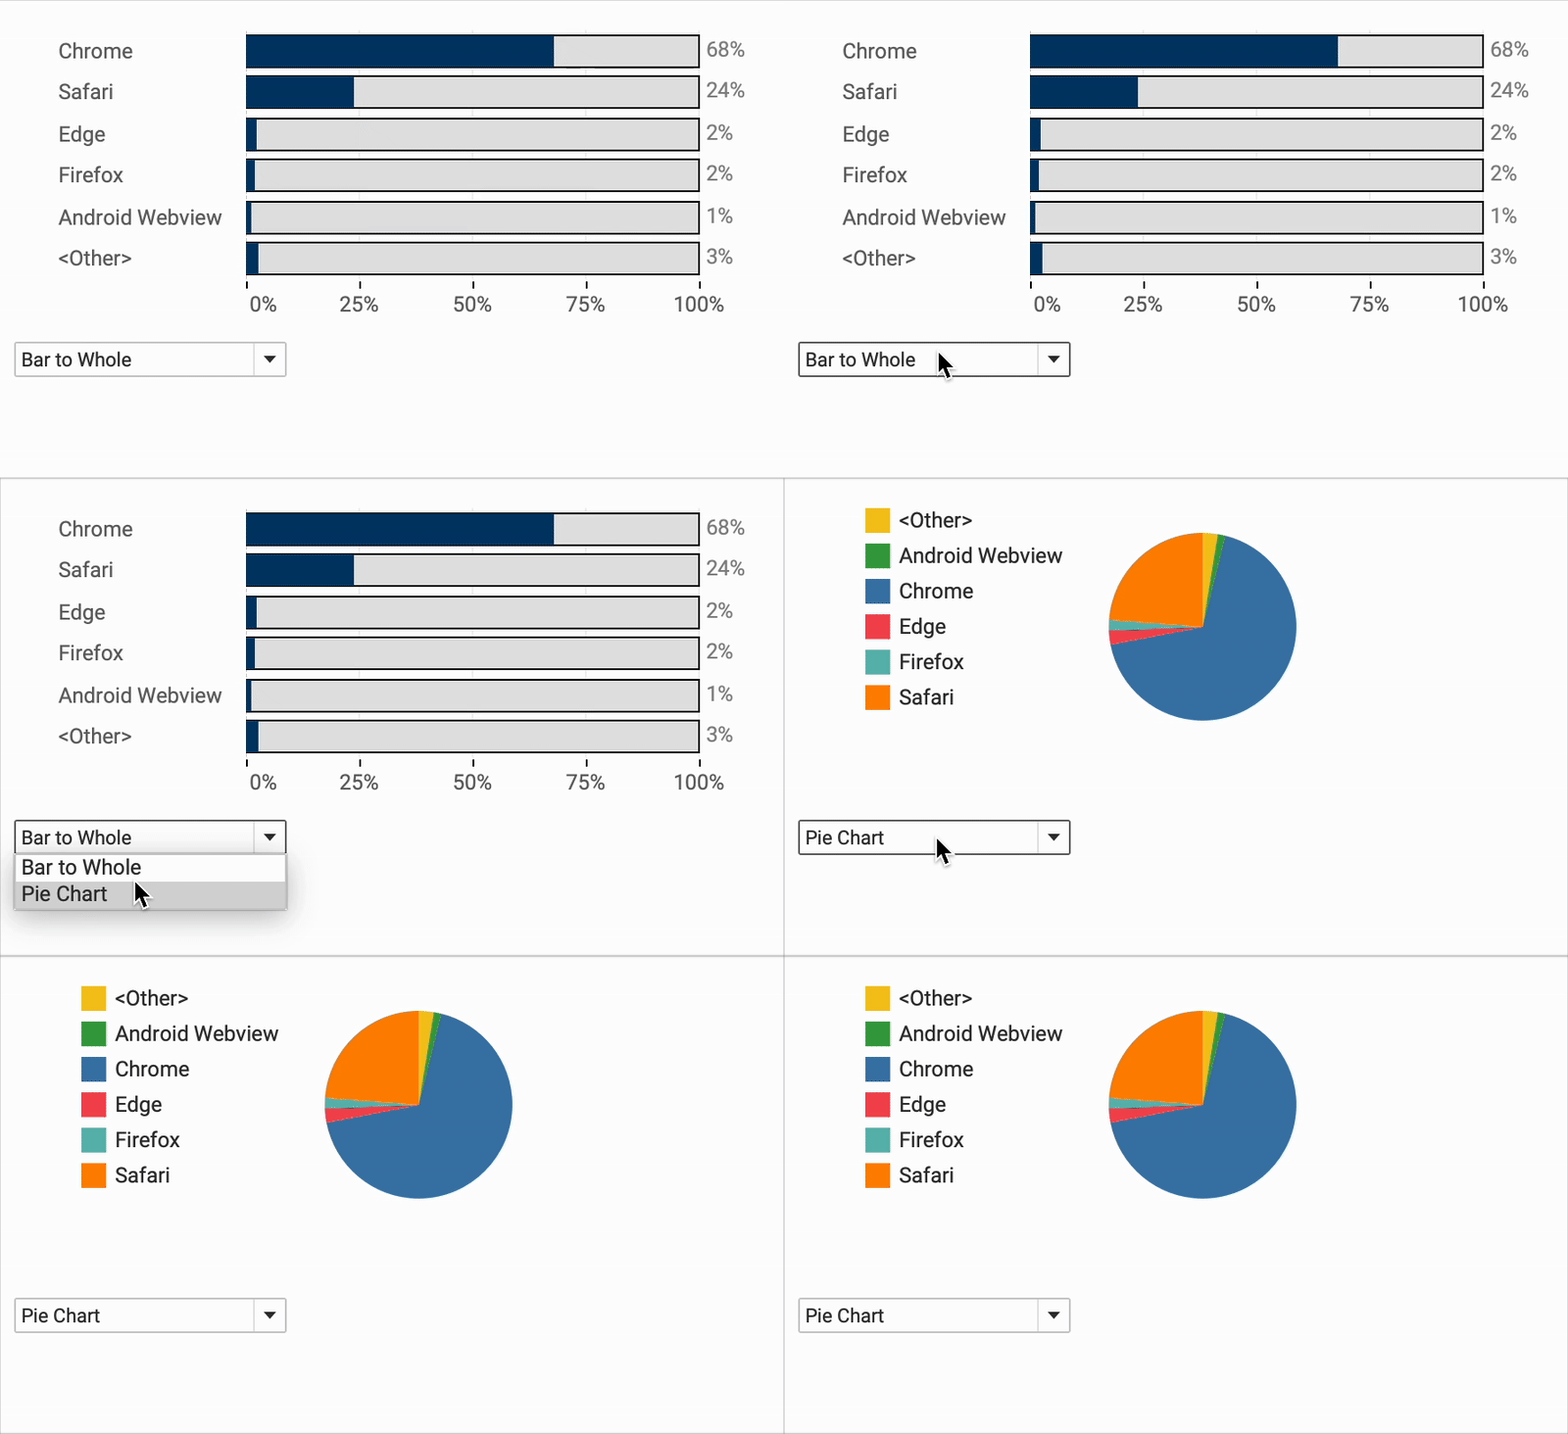

[Read more…] about Letting Users Choose Their Visual

Antichaos

Copyright © 2025