It’s my personal yearly end-of-December Christmas tradition: visualizing the Top 2000 hitlist of NPO Radio 2 (a Dutch national radio station).

(you can also view the interactive visualization on Tableau Public)
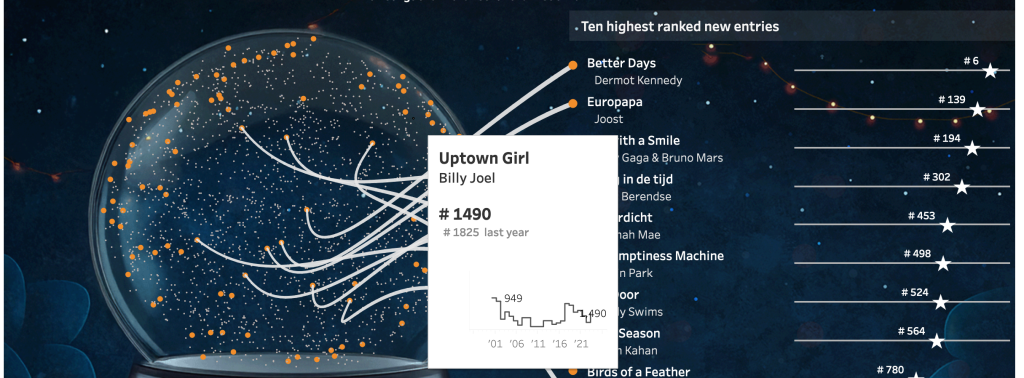
Design: Snowglobe
For a completely different look I have used a snow-globe which contains all songs within the list / dataset. Every ‘snowflake’ is a song, and if you hover over it you can see the title and the artist, but also all positions of the song trough the years.
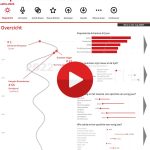
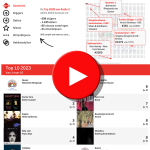
Using the menu you can choose between different ‘cross sections’ of this years Top 2000: a general overview, new entries, drop-outs, …
Features: Bezier curves, Map Layers & Bilingual
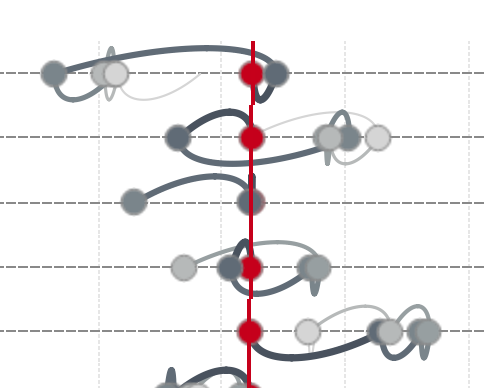
The connectors between the “snowflakes” and the featured songs on the right are created using bezier curves, a parametric curve based on (in this implementation) three points: a start point, end-point, and two points which define the curve. I have used this technique five years ago in the Top 2000 visualization of that year.
Plotting of the different points (snowflakes), is done on map layers within Tableau. Although this functionality is meant to be used on spatial visualizations (maps), it is a perfect way to combine different visualizations on a single sheet. All x and y coordinates of the snowflakes are converted into spatial points, and the bezier curves are used within the same sheet. Using the map layers solves a lot of problems which otherwise would result in misaligned datapoints and -lines.
The background image is designed by Vlad Studio, you can download the full version as wallpaper for Smashing Magazine.

English and Dutch
Because the dashboard is about a Dutch phenomenon – the Top 2000 – I also wanted to create a Dutch version of it. In the past I have created ‘translated’ copies of the dashboard, but this time I have a single dashboard with a language switch. All text, including the tooltips, are available in both English and Dutch, but I didn’t translate the names of the songs and/or artists… (if you want to know: ‘Twee Motten’ translates to ‘Two clothes moths’ 😉 )
History
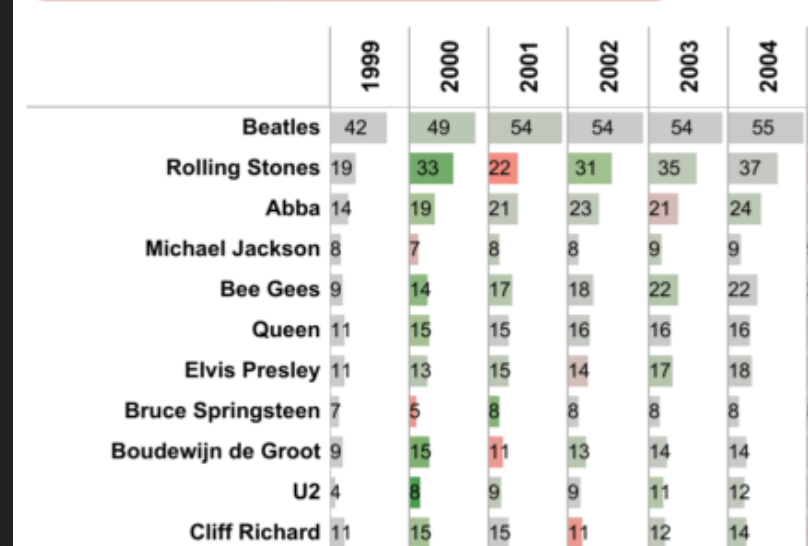
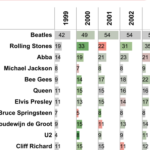
Since 2011 (!) I have visualized the list in all kind of ways. Started out as a really simple visualization of all songs in the list, I have ‘progressed’ by using more advanced Tableau techniques – in data visualization, calculations, prep and art.