Every year, the Dutch Radio 2 Top 2000 offers an updated dataset with 2000 songs – and every year, it challenges me to create a completely perspective on it.
The challenge to me isn’t what the data is, but how to see it again with fresh eyes. After 14 years of exploring bar charts, Bézier-inspired snow globes, and long-form dashboards, this year I opted for a 3D grid.

This post looks behind the scenes of that process: the design choices, technical constraints, and small visual tricks that shaped this year’s visualization. For the TL;DR people: the interactive dashboard can be found here.
Design: From list to grid
A ranking is inherently flat: a simple line of numbers ordered from 1 to 2000. But exploring a ranking is rarely that flat. Analysis introduces movement, perspective, and hierarchy.
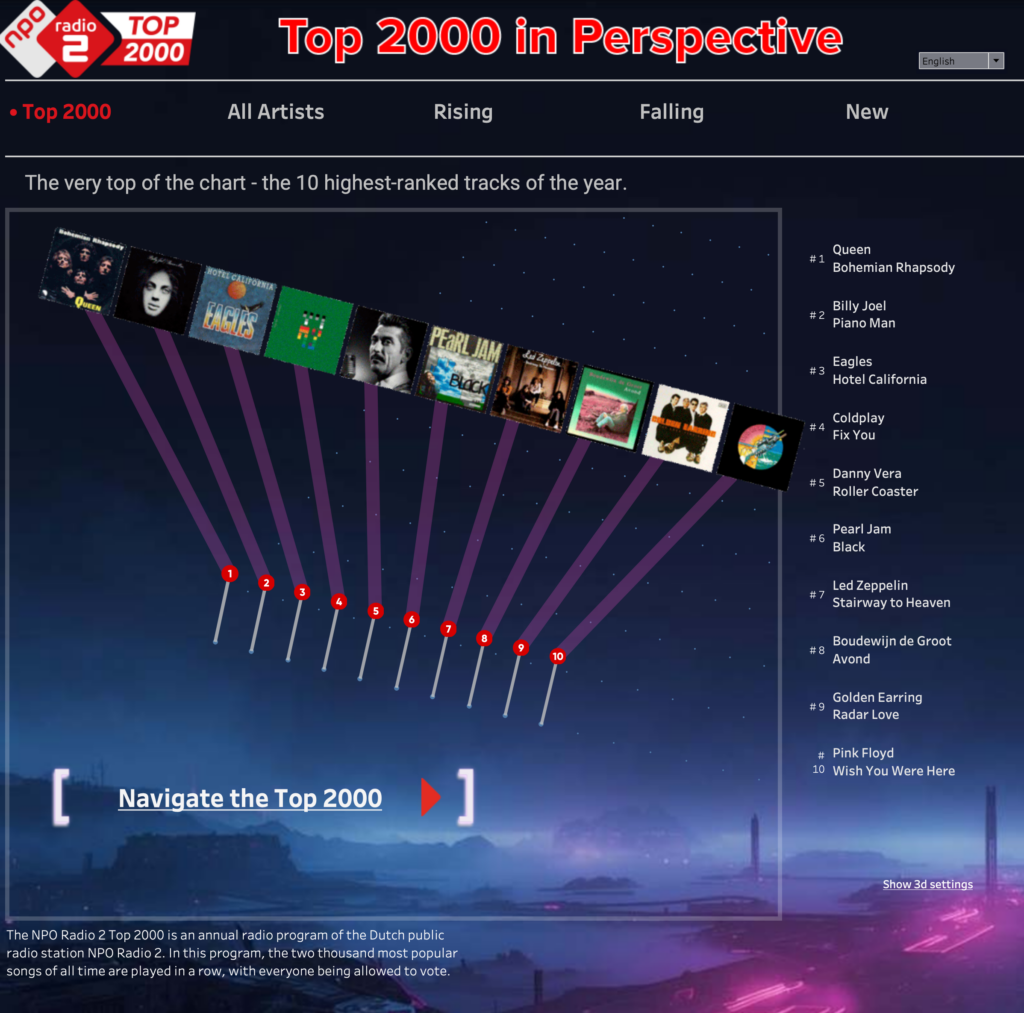
For this edition, I chose to ‘break’ the list into a structured grid: a two-dimensional surface that can be reshaped, tilted, and explored. A plane of 2,000 points placed into a three-dimensional perspective, where the most interesting points are gently lifted into space.
Challenge: The illusion of 3D without 3D
This visualization is not actually 3D. Everything you see is still a 2D scatter plot. The sense of depth comes from illusion, not geometry. Three techniques work together:
- Perspective projection
X and Y positions are warped toward a vanishing point, creating depth. - Size scaling
Points closer to the viewer appear larger; distant ones shrink. - Atmospheric depth
Color and contrast subtly fade toward the horizon.
Together, these ‘tricks’ create a believable sense of space. Besides the fact that Tableau doesn’t support 3d rendering, “true” 3D would have introduced interaction complexity, occlusion problems, and performance issues.
But a real – even physical – 3D visualization is still on my to-do list, and is planned for 2026…
Cleaning, Prepping and using the data
Although the data is very similar each year (relative many tracks don’t leave the list year after year), some cleaning is always needed. I copy the data from a Wikipedia page – which contains a table with all songs which ever appeared in the Top 2000 in the last 26 years.
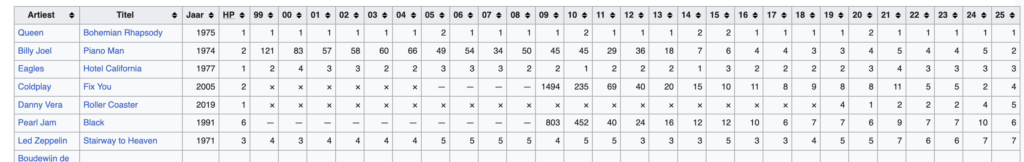
Un-pivoting the years (converting the year-columns to rows) and converting all non-numeric values to integers can be done in Tableau, but I created a Python script to do this for re-usability and control.
Tracks per artist – including duets and other collaborations
One of my goals this year was to improve the analysis on count of tracks per artist. If Queen did a fantastic collaboration with David Bowie (Under Pressure), I want to count this track if you select either Queen or David Bowie.
Creating a script which identifies all different artists from the ‘artist’ column was harder than expected. Splitting by ‘and’, ‘&’, ‘featuring’, and commas seemed right at first, but now I got non-existing artist like ‘Kool’, ‘The Gang’, and just ‘Womack’ – instead of ‘Womack & Womack’. Maybe AI could help me with this, but for now I edited the data manually.
Lack of ‘extra’ data
The organizers of the Top 2000 collect a wealth of information about voters – such as age, gender, and location – and use it to create their own analyses and insights. Unfortunately, this data is not publicly available.
A few years ago, I explored the list using data from Spotify, including cool metrics like danceability. Unfortunately, that API is no longer accessible for new projects, which limits what can be done today.
Access to richer data on both voters and tracks would allow for deeper, more expressive visualizations. For now, we work with the data that’s available, making the most of what we have. And, truth be told, incorporating extra data often requires significant effort: both to reliably join it to the dataset and to visualize it in an engaging way.
Formatting – choosing a background image
Using the 3d grid in an empty space didn’t feel right – a nice background can enhance such visualization without distracting from the data itself too much.

I found an image with an empty sky to plot the data on, and a futuristic / industrial skyline. This made the grid doesn’t sit on the ground anymore. It hovers in the air.
Designing for density
Two thousand points is a lot – even when arranged in 40 neat rows of 50. To keep the visualization readable, several design decisions were made to reduce noise and guide attention.
- Most of the dots are intentionally muted (small, gray), allowing the important ones to stand out.
- Accentuated marks receive subtle outlines, while size is carefully constrained so nothing disappears or overwhelms.
- Colors remain soft and restrained, avoiding harsh categorical contrasts.
- When necessary, the view allows for zooming, and the first and last positions – 1 and 2000 – are explicitly highlighted to anchor the scale.
- The height of highlighted points, together with the tilt and yaw of the plane, work together to create depth without distraction.
- Labels are used for reference (position in the list) – tooltips give more information on each mark.
- Since my audience is – of course – partially Dutch, the dashboard is bi-lingual. Titles, text and tooltips can be switched between English and Dutch.
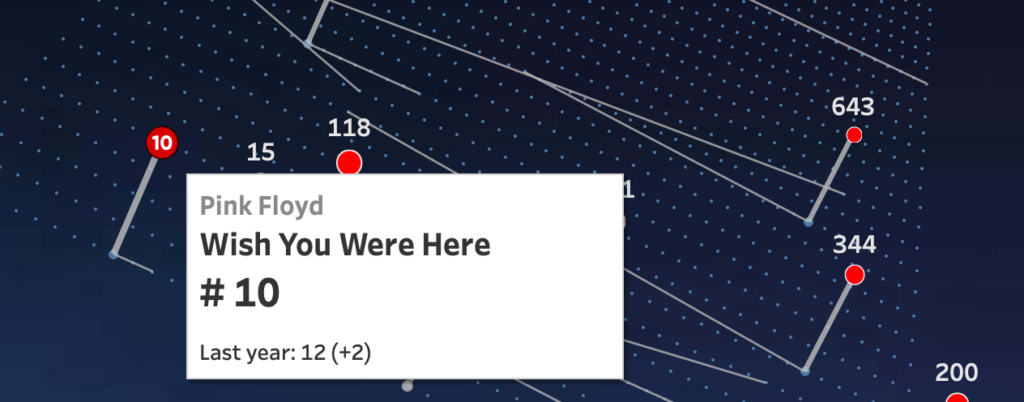
The goal was to reveal what matters while preserving context and spatial coherence. This is not meant to be read like a table, it’s meant to be scanned, explored.
Tableau Techniques
Within Tableau I have used several features – and some not (on purpose):
- The visualization is a single dashboard (no navigation between separate dashboards)
- The simulated 3D grid is created using multiple calculations, starting from rows and columns to the projected 3D using perspective calculations like tilt, yaw and camera distance. These parameter can be changed withing the viz (look at the bottom right)
- All marks are plotted on the sheet using map layers. This feature gives such an amazing flexibility in adding marks, formatting, and especially the ability to add/remove from zoom extent, and disabling selecting marks/lines.
- No extensions are being used
- No external images (to avoid warning messages on Tableau Public)
- A language parameter controls calculations and sheet visibility, so all elements, including tooltips, appear in the chosen language.
- The language strings are set in calculations themselves, text elements and in a different datasource controlling the menu
- The 3D settings for each menu-item are controlled using values in the menu itself and parameter actions.
What this visualization is (and isn’t)
Primarily, it is fun for me: the 15th version of a Top 2000 visualization in as many years (almost all still available!).
It is definitely not created as an example of best data visualization practice, but as an example of: how data can be visualized alternatively, give a different look at the data, and the capabilities of Tableau (and of course my own skills).
It is not a definitive ranking analysis or a precise analytical tool, but a way to see familiar data differently, and possibly a reminder that data can be playful without losing meaning.
View and use this dashboard yourself, and let me know what you think of this!